April 16th, 2026
Improved
CONTROL PANEL
APP

3.11.0
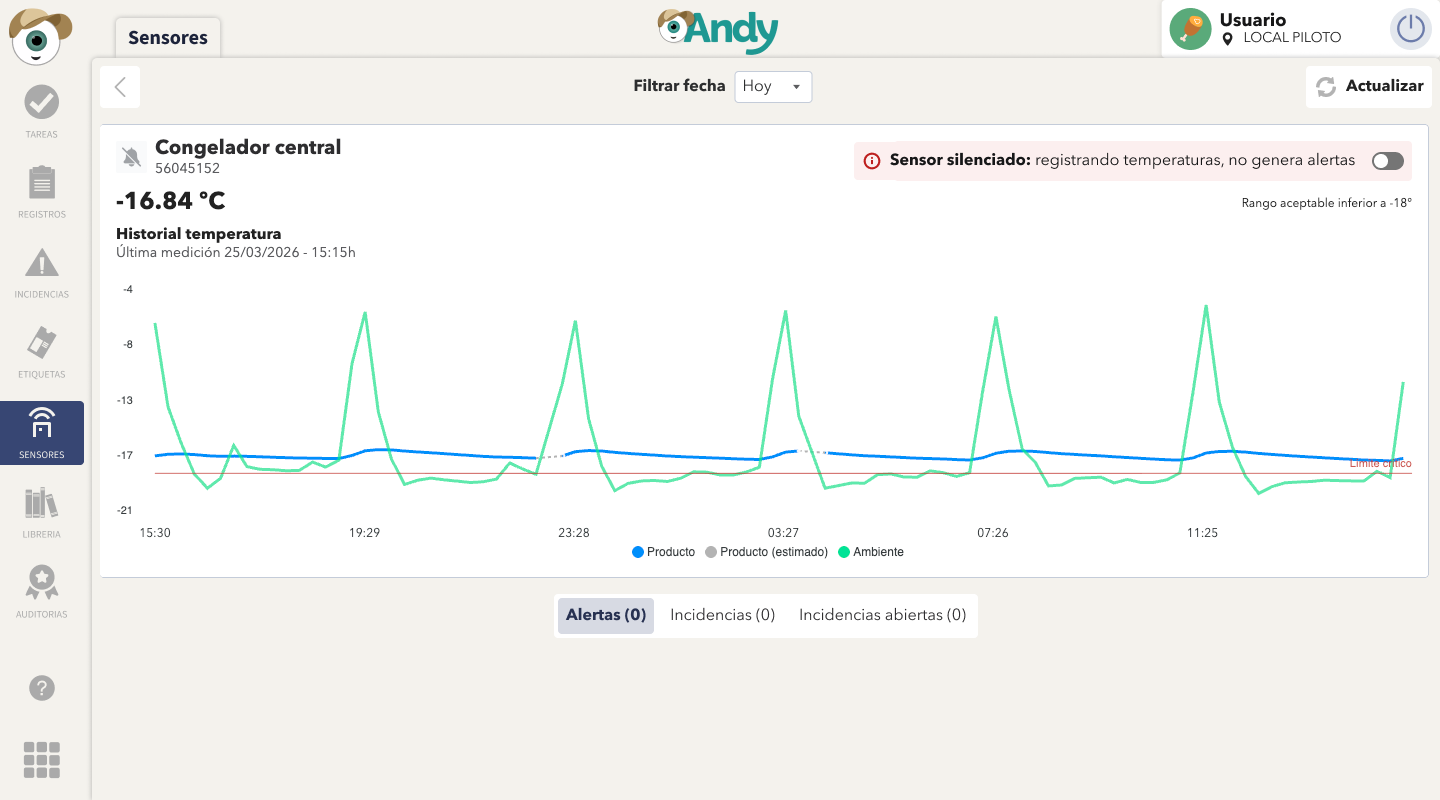
(1) Improved chart visualization
The chart has been enhanced by adding a dashed line (- - - -) to indicate periods where no real measurements are available and the displayed value is an approximation.
Additionally, the chart legend now clearly shows product temperature, estimated value (in grey), ambient temperature
APP
CP
Improvements based on your feedback
KPI clarity has been improved by renaming “Alerts” and “Incidents” to “With alerts” and “With incidents”, enabling a more direct and intuitive interpretation of the displayed data.

The notifications counter has also been updated to show the total number of alerts and incidents, rather than the number of affected sensors.

APP
CSV Report Downloads
You can now download reports in CSV format directly from the Control Panel

CP
Pagination in sensor details
Navigate between sensors directly from the detail view using the new previous and next controls, without leaving the page.
